
| Home | ||
| Products | ||
| Download | ||
| Screen Shots | ||
| Support | ||
| Free License | ||
| Customers | ||
| Company | : | About Us |
| Mailing List | Contact Us | |
| News | ||
| Feedback | ||
| Privacy Policy | ||
| Legal Notice |
Graphic Remedy offers gDEBugger version 5.8.1 for free. Simply install and run gDEBugger; registration or license are not needed. The latest gDEBugger version can be downloaded from here.
Graphic Remedy offers free gDEBugger licenses for gDEBugger version 5.8. After running gDEBugger for the first time, users can follow a simple registration process to receive a free one-year license. The latest gDEBugger version can be downloaded from here.
The new gDEBugger V5.8 introduces gDEBugger CL. This new product brings gDEBugger's advanced Debugging, Profiling and Memory Analysis abilities to the OpenCL developer's world, helping OpenCL developers find bugs, optimize parallel computing applications performance and memory consumption. gDEBugger CL supports OpenCL versions 1.0 and 1.1. It is available for Windows, Linux and Mac OS X.
The new gDEBugger V5.6 introduces iPhone and iPad on-device debugging and profiling. These features greatly enhance gDEBuggers debugging and profiling capabilities over the iOS platform, letting developers get the most out of the iPhone and iPad devices.
March 9, 2010, San Francisco, Game Developer Conference 2010 - Graphic Remedy, a leading provider of advanced solutions for 3D graphics developers, today launched gDEBugger CL. gDEBugger CL allows OpenCL-based application developers to deliver complex parallel computing applications and significantly improves application performance. gDEBugger CL offers advanced debugging, profiling and memory analysis capabilities that reduce development time, accelerate time to market, help deploy the application on multiple platforms and boost application parallel computing performance. For more information about gDEBugger CL, visit: /gDEBuggerCL.php.
Graphic Remedy's solutions are designed to assist developers in creating more sophisticated parallel computing and 3D graphics applications over various platforms and devices. The gDEBugger product line is the leading real-time OpenGL®, OpenGL ES® and now OpenCL™ debugger, profiler and graphic memory analyzer. gDEBugger solutions are available for Windows, Linux, Mac OS X and iPhone
gDEBugger CL traces the application's activity on top of the OpenCL™ API and enables programmers to see what is happening within the system implementation, to identify bugs and to optimize the application's parallel computing performance. This new solution will allow developers to maximize the utilization of the available system resources and enable them to deliver better applications over heterogeneous parallel computing platforms consisting of CPUs, GPUs and other processors.
Graphic Remedy will exhibit a preview of gDEBugger CL and gDEBugger iPhone on-device debugging and profiling at this year's GDC, San Francisco, March 9th - 13th.
gDEBugger CL is a new and exciting product; it brings all of gDEBugger's Debugging and Profiling capabilities to the OpenCL developer's world. gDEBugger CL, now in beta testing, supports all OpenCL implementations on Windows, Mac OS X and Linux
The upcoming gDEBugger iPhone version includes on-device debugging and profiling abilities, running in real-time and letting developers optimize their game on the actual iPhone device. gDEBugger iPhone displays invaluable inside information such as iPhone's GPU, CPU, graphic driver and operating system performance counters.
The conference program includes:
As part of this session, we will demonstrate the new gDEBugger CL debugging and profiling an OpenCL based fluid dynamics application.
Thursday, March 11, 1:30pm-2:30pm Room #123, North Hall
The latest of gDEBugger GL and gDEBugger iPhone will be demonstrated at the demo area in the back of the room. Demos will be held before and after the OpenGL session.
Thursday, March 11, 3:00pm-4:00pm Room #123, North Hall
You are welcome to visit us at the Expo show floor, see the latest analysis features of gDEBugger in action and talk with the gDEBugger development team. We will be located at the NVIDIA booth (#1702), Developer tools pod, on:
An "Advanced OpenGL, OpenGL ES and OpenCL debugging and profiling using gDEBugger" demo and presentation will be given by the gDEBugger team.
Saturday, March 13, 11am, NVIDIA booth (#1702)
You are welcome to visit us at the Expo show floor, see the latest analysis features of gDEBugger in action and talk with the gDEBugger development team. We will be located at the Khronos booth (#1443)
The gDEBugger team looks forward to meeting you at the Game Developer Conference.
The new gDEBugger V5.5 introduces new AMD (ATI) GPU Performance Counters Integration, displaying AMD graphic hardware and driver performance counters in gDEBugger's Performance Graph and Performance Dashboard views, allowing developers to optimize their application over AMD (ATI) graphics hardware.
Graphic Remedy is proud to announce the upcoming release of gDEBugger for OpenCL on Windows, Mac OS X and Linux. This new product will bring gDEBugger's advanced Debugging, Profiling and Memory Analysis abilities to the OpenCL developer's world, helping OpenCL developers find bugs, optimize parallel computing applications performance and memory consumption.
Click here to join the Free Beta Program, see screenshots and more details.
The new gDEBugger V5.4 adds support for the Windows 7 operating system, OpenGL 3.2 and all extensions promoted to the core OpenGL specification, as well as several other new extensions.
In addition, the new release contains many bug fixes and performance improvements for all platforms
The new gDEBugger V5.3 contains the official release of gDEBugger iPhone. This new product allows OpenGL ES based application developers to enjoy advanced debugging and profiling capabilities, helping them reduce development time, deliver high quality applications and significantly improve graphic rendering performance for the iPhone platform.
In addition, the new release adds the long awaiting support for Windows and Mac 64-bit support, as well as support for Snow Leopard (Mac OS X 10.6).
August 3, 2009 New Orleans, SIGGRAPH 2009 - Graphic Remedy, a leading provider of advanced solutions for 3D-graphics developers, today announced gDEBugger iPhone release. gDEBugger iPhone allows OpenGL ES® based application developers to deliver more-complex 3D-graphics apps and significantly improve rendering performance. gDEBugger iPhone offers advanced debugging and profiling capabilities that reduce development time and accelerate time to market.
gDEBugger iPhone traces the application's activity on top of OpenGL ES API and enables programmers to see what is happening within the graphic system implementation, identify bugs and optimize the applications' rendering performance. The new solution will allow developers to maximize utilization of the available iPhone graphic resources and enable them to deliver even better games and applications on this platform.
gDEBugger iPhone fully supports OpenGL ES® 1.1 and 2.0. The new product has been tested by over 200 developers worldwide who participated in the company's gDEBugger iPhone Beta program. User responses have been highly enthusiastic and complimentary.
"gDEBugger iPhone is, for us, an indispensable development tool", states Stephen Northcott, Founder and CEO of Ginetix Consulting and a long-time developer of Mac and iPhone applications. "Developing for the iPhone and OpenGL ES presents even more of a "black box" than normal OpenGL implementations. Moreover, efficient asset management is essential on low memory devices. The ability to view assets such as shaders, textures and buffer objects in minute detail, at any point in a programs execution, and comprehensively profile OpenGL / GLES code, as well as edit and test GLES2.0 shaders 'on the fly', literally doubled or even tripled our productivity and problem solving capabilities."
Northcott and his team have been active participants in gDEBugger iPhone beta program since June. "We developed one full iPhone app prior to utilizing gDEBugger and were able to increase the efficiency of our graphics engine by over 30% in only 2 days once we deployed gDEBugger iPhone", he testifies. "On current projects, we have been able to achieve amazing optimizations in stunningly short development periods thanks solely to gDEBugger's comprehensive feature set. Quite simply, we recommend it to all OpenGL and GLES developers as a must have tool."
When asked to elaborate how efficiency increased, Northcott explains: "We gained 5 or 6 FPS on the iPhone, which took our application up to just over 20 FPS. That's a threshold point, where touch and acceleration controls seem properly responsive to the player, offering the freedom to add some more quality to the visuals."
The new gDEBugger V5.2 adds a new Vertex Batch Statistics view to the gDEBugger Statistics viewer. OpenGL draw function calls are grouped by the number of vertices they push into the graphic pipeline, allowing the user to view and improve the ratio between API calls made and vertices drawn.
In addition, the new release introduces OpenGL primitive performance counters, displaying the total number of render primitives and vertices drawn per frame, as well as a breakdown to the specific primitive types (points, lines and triangles).
Version 5.2 also includes a public beta release of gDEBugger iPhone. gDEBugger iPhone runs on top of Apple's iPhone Simulator, enabling developers to debug and optimize iPhone OpenGL ES-based applications within their primary work environment. More information about gDEBugger iPhone is available here.
Graphic Remedy is proud to announce the upcoming release of gDEBugger for the iPhone platform.
gDEBugger iPhone will allow OpenGL ES based application developers to enjoy advanced debugging and profiling capabilities, helping them reduce development time, deliver high quality applications and significantly improve graphic rendering performance.
gDEBugger iPhone includes various features that enable developers to:
- Improve application rendering performance
- Optimize the application's graphic memory consumption
- Locate and break on redundant state changes
- Locate and break on OpenGL ES errors
- Locate and break on graphic memory leaks
- Locate unrecommended OpenGL ES function calls
- View texture objects data as an image or as "raw data"
- Compare current state variable values to OpenGL ES default values
And so much more
The complete gDEBugger iPhone version is planned for released in August 2009.
The new gDEBugger V5.1 adds the ability to view Vertex Buffer Objects (VBOs) data. The Textures and Buffers viewer Data View tab displays the selected VBO's data in a spreadsheet. The user can select the displayed data format, offset and stride.
The new gDEBugger V5.0 adds support for OpenGL 3.0 and OpenGL's new deprecation model. A new Deprecated Function Statistics tab was added to the Statistics viewer. This tab displays information about deprecated functions and deprecated behaviors used by the debugged application. This tab also suggests forward-compatible replacements to each deprecated feature.
gDEBugger V5.0 also includes gDEBugger for Apple Mac OS X. This new product brings all of gDEBugger's Debugging and Profiling abilities to the Mac OpenGL developer's world.
Graphic Remedy will launch the first official version of gDEBugger Mac at this year's Game Developers Conference, San Francisco, 23-27 March. On Tuesday March 24, gDEBugger Mac will be demonstrated, all day long, in the Khronos Developer University full-day tutorial area.
Fully functional trial version of gDEBugger Mac is now available for download.
gDEBugger Mac brings all of gDEBugger's Debugging and Profiling abilities to the OpenGL Mac OS X developers world.
The new gDEBugger V4.5 adds the ability to view texture mipmap levels. Each texture mipmap levels parameters and data (as an image or raw data) can be displayed in the gDEBugger Texture and Buffers viewer. Browse the different mipmap levels using the Texture Mipmap Level slider.
gDEBugger V4.5 further introduces support of 1D and 2D texture arrays. The new Textures and Buffers viewer Texture Layer slider enables viewing the contents of different texture layers.
This version also introduces notable performance and stability improvements.
The new gDEBugger V4.4 adds in-depth analysis of the OpenGL memory usage by tracking graphic memory allocated objects, their memory consumption and allocation call stacks. Also new in this version are graphic memory leak detection and the ability to break on them.
Using these new features will enable the OpenGL and OpenGL ES developers to optimize their applications memory consumption and improve overall application performance.
OpenGL application developers optimize performance on Chrome 400 GPUs with gDEBugger
Fremont, California and Tel Aviv, Israel, 6 October 2008 - S3 Graphics, a leading provider of graphics and visualization technologies, and Graphic Remedy, an innovative provider of OpenGL performance tools, today announced the support of the latest Chrome 400 Series GPUs with the gDEBugger performance measurement utility. The Chrome 400 Series GPUs support the latest OpenGL 2.1 API and hardware HD video decode for Blu-ray playback.
S3 Graphics and Graphic Remedy have been working closely together over the past year on incorporating S3 Graphics hardware and driver support into gDEBugger. This combination offers a powerful performance optimizing solution for OpenGL application developers using S3 Graphics hardware. "The aim of the S3 Graphics and Graphic Remedy cooperation is to give developers the best-in-class solution and get the optimal results and usability out of S3 Graphics hardware," said Avi Shapira, CEO of Graphic Remedy.
The powerful integration between gDEBugger and S3 Graphics provides real-time statistics (performance counters) representing utilization, throughput, and other performance metrics within the S3 Graphics hardware and driver. Monitoring these performance counters allows unprecedented visibility of graphics activity and throughput at various points in the graphic pipeline. OpenGL developers can use these performance counters to identify graphic pipeline bottlenecks, optimize their code based on application feedback, and measure the success of different optimizations they apply.
"gDEBugger is an excellent solution for OpenGL developers who care about the performance of their application. S3 Graphics has been working extensively with Graphic Remedy to ensure that gDEBugger fully supports our current and future graphics architectures. The integration of gDEBugger with S3 Graphics hardware performance metrics gives developers valuable, in-depth analysis of any OpenGL application to get the most out of our hardware using this advanced tool," said Iming Pai, VP of Software at S3 Graphics.
Streamlining the OpenGL Debugging and Profiling ExperiencegDEBugger is a powerful OpenGL and OpenGL ES debugger and profiler. It delivers one of the most intuitive OpenGL development toolkits available for graphics application developers. gDEBugger lowers development cost by saving debugging and profiling time, boosting application robustness by tracing application activity on top of OpenGL to provide the needed information a developer needs to find bugs, and optimizing application rendering performance. Read more...
The new gDEBugger V4.3 adds in-depth analysis of the OpenGL usage by tracking redundant state changes and detailed usage statistics.
This new feature includes various capabilities, such as noting unrecommended OpenGL functions (with a detailed explanation of why are they unrecommended and possible alternatives) and in-depth information about the usage of OpenGL State Change functions, including redundancy percentages and amount of redundant / effective calls.
The S3 Graphics performance counters integration is also introduced in this version. This powerful integration works on all S3 Graphics hardware, giving very detailed information of the hardware utilization to allow optimizing the OpenGL usage on S3 Graphics hardware using gDEBugger.
The new gDEBugger V4.2 adds full support for Frame Buffer Objects (FBOs). It enables developers to view allocated FBOs and Renderbuffer objects, FBOs attachment points (depth, color and stencil) and Renderbuffers data as an image and raw data.
This version adds full support for OpenGL context sharing. Shared objects are now displayed in each and every render context that shares them. In addition, NVIDIA GLExpert driver (v2.0) was integrated into this version.
The new gDEBugger V4.1 adds Geometry Shaders Support, and enables developers to view allocated geometry shader objects, shaders source code and properties. It also allows to Edit and Continue shaders on the fly.
A new ATI (AMD) performance metrics integration was added, supporting the new ATI driver performance metrics infrastructure. This integration enables users to view ATI performance metrics such as hardware utilization, vertex wait for pixel, pixel wait for vertex, overdraw and more. These performance metrics together with gDEBuggers Performance Analysis Toolbar provide a powerful solution for locating graphic system performance bottlenecks.
The new gDEBugger V4.0 introduces gDEBugger Linux. This new exciting product adds 32bit and 64bit Linux Support, bringing all of gDEBugger's debugging and profiling abilities to the Linux OpenGL developers' world.
A new Textures and Buffers Viewer was added. This Viewer allows you to view textures, static buffers and pbuffers objects as images or raw-data in its original data format, including none RGB data formats (float, depth, integer, luminance, etc).
This version also includes significant performance improvements.
gDEBugger, an OpenGL and OpenGL ES debugger and profiler, traces application activity on top of the OpenGL API, lets programmers see what is happening within the graphic system implementation to find bugs and optimize OpenGL application performance.
gDEBugger, an OpenGL and OpenGL ES debugger and profiler, traces application activity on top of the OpenGL API, lets programmers see what is happening within the graphic system implementation to find bugs and optimize application performance.The new V3.1 Adds Support for debugging and profiling OpenGL applications on Windows Vista™. Also, gDEBugger OpenGL state variables Comparison Viewer now automatically compares all current state variables values to the OpenGL default render context values. This version also includes significant performance improvements.
gDEBugger, an OpenGL and OpenGL ES debugger and profiler, traces application activity on top of the OpenGL API, lets programmers see what is happening within the graphic system implementation to find bugs and optimize application performance.
The new V3.0 supports OpenGL V2.1 standards and contains ATI Hardware Performance Counters (Percentage Hardware busy, Transform Clip Lighting unit busy, etc.) integration. These counters are displayed in the Performance Graph and Performance Dashboard Views. V3.0 also adds the option for Floating Licenses with a dedicated License Server.
gDEBugger, an OpenGL debugger and profiler, traces application activity on top of the OpenGL API, lets programmers see what is happening within the graphic system implementation to find bugs and optimize application performance.
The new V2.3 introduces a Calls Statistics view that allows viewing the number of times each OpenGL function call was executed in the previous frame and it's percentage from the total functions execution count. The list is updated each and every time the process is suspended. This invaluable insight information helps you locate (and then remove) redundant OpenGL function calls, state changes, etc.
This version also adds support for GL_ARB_texture_rectangle and GL_NV_texture_rectangle.
gDEBugger, an OpenGL debugger and profiler, traces application activity on top of the OpenGL API, letting programmers see what is happening within the graphic system implementation to find bugs and optimize application performance.
The new V2.2 introduces a Shaders "Edit and Continue" ability which allows you to Edit, Save and Compile Shaders source code, Link and Validate Programs "on the fly". This feature saves developer time required for rebuilding and running again the developed application.
This version also adds support for 8 OpenGL extensions.
gDEBugger, an OpenGL debugger and profiler, traces application activity on top of the OpenGL API, letting programmers see what is happening within the graphic system implementation to find bugs and optimize application performance.
The new V2.1 introduces a State Variables Comparison Viewer which allows you to inspect the OpenGL state variables values. You can compare two state variables snapshot files, compare the selected context state variables values to a snapshot file or compare the selected context state variables values to the values recorded at the previous debugged process suspension.
gDEBugger, an OpenGL debugger and profiler, traces application activity on top of the OpenGL API, letting programmers see what is happening within the graphic system implementation to find bugs and optimize application performance.
This major version includes two new profiling views: Performance Graph View and Performance Dashboard View. These two views contain performance counters graphs of gDEBugger, Windows and vendor-specific graphic boards (NVIDIA and 3Dlabs), including: CPU/GPU idle, graphic memory consumption, vertex and fragment processors utilizations, number of function calls per frame, amount of loaded textures and texels, frame per second, and many others. Using the gDEBugger Performance Analysis toolbar together with the new Performance views enables you to easily pinpoint graphic pipeline performance bottlenecks.
gDEBugger, an OpenGL debugger and profiler, traces application activity on top of the OpenGL API letting programmers see what is happening within the graphic system implementation.
The new V1.5 introduces a Shader Viewer that displays a list of shading programs and shaders existing in each render context. This viewer displays each shader's source code and parameters. Also displayed is a list of each program's attached shaders, active uniforms values and program parameters.
In addition, this version supports multithreaded applications, displaying a list of the debugged process threads and thread current render contexts. The Call Stack View now displays the call stack of any chosen thread.
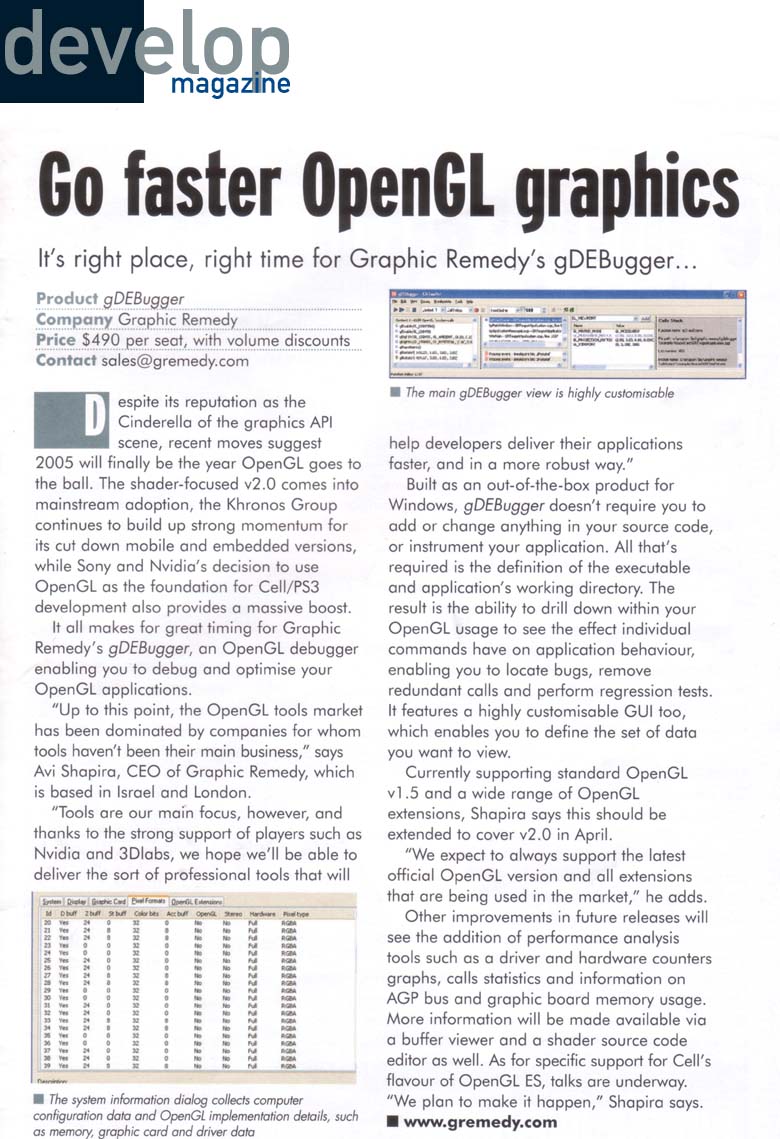
It's right place, right time for Graphic Remedy's gDEBugger...
Read the full article...
Your opinion is important to us! As part of our ongoing effort to make gDEBugger a more productive tool, we ask that you take a moment to fill out this short survey.
A drawing will be held among all survey participants - the lucky winner will receive a free gDEBugger license!
gDEBugger, an OpenGL API debugger and profiler, traces application activity on top of the OpenGL API letting programmers see what is happening within the graphic system implementation.
The new V1.4 supports the OpenGL 2.0 standard and many additional extensions. The latest features include forcing the debugged application to use a stub fragment shader and forcing it to render using no lights. These features enable the pinpointing of application graphic performance bottlenecks caused by either fragment shaders or light-related calculations.
In addition, gDEBugger contains a powerful break-on-detected error mechanism that breaks the debugged application run when detected errors occur. The texture viewer now displays images and properties of multi-textures.
Thanks to our friends at Graphic Remedy for showing their awesome gDEBugger tool at our GDC booth.
gDEBugger traces application activity on top of OpenGL to provide the information you need to find bugs and to optimize application performance.
It also includes many special graphics-related features such as the ability to view render context state variables, view allocated textures properties and image data, break on OpenGL errors, put breakpoints on OpenGL or extensions functions, view the application call stack and source code, and much more.
For everyone who has been asking about NVPerfHUD for OpenGL, you're going to love gDEBugger. Check out the free 7 day trial.
How to use gDEBugger to track down problems and optimize performance in OpenGL applications.
Download presentation slides (1.5 MB)...
Graphic Remedy has released a new version of gDEBugger that allows you to pinpoint the exact location of application performance bottlenecks in the graphic pipeline. gDEBugger, an OpenGL API debugger, traces application activity on top of the OpenGL API letting programmers see what is happening within the graphic system implementation.
Version 1.3 includes a set of commands enabling you to turn off the graphic pipeline stages one after the other. For example, you can turn off stages such as: Eliminate all OpenGL Draw Commands, Force Single Pixel View Port and Force 2x2 Stub Textures.
By following application performance using the heads-on FPS display when turning off individual stages, you can determine the exact location of a bottleneck.
Graphic Remedy is exhibiting gDEBugger at this year's Game Developers Conference, San Francisco, 7-11 March.
The conference program includes:
Graphic Remedy has released a new version of gDEBugger that supports textures. gDEBugger, an OpenGL API debugger, traces application activity on top of the OpenGL API letting programmers see what is happening within the graphic system implementation.
Version 1.2 includes an interactive texture viewer that displays render contexts texture objects, texture objects parameters and the textures' data as an image. 1D, 2D, 3D and cube map texture data viewing is supported.
In addition, the recorded text OpenGL Calls Log file has been replaced with an HTML log file that displays textures associated with the logged OpenGL function calls. This version also includes performance improvements, bug fixes and new OpenGL extensions support.
gDEBugger is an OpenGL API debugger that lets programmers trace application activity on top of the OpenGL API to see what is happening within the graphic system implementation.
The new v1.1 includes "Interactive Mode" and "Raster Mode" toolbars which enable programmers to watch objects as they are being rendered in shaded, point or wire-frame mode and break the program execution where they would like to debug.
It also now supports applications that load OpenGL32.dll dynamically and applications that use OpenGL through an ActiveX control / OCX / COM object.
Graphic Remedy released gDEBugger Version 1.0. This OpenGL debugger supports OpenGL 1.5 standard and additional extensions.
The latest features include call stack and source code views which enable a user to view the function calls and source codes that led to the debugged breakpoint hit, OpenGL error, exception or OpenGL call.
This version also contains many bug fixes making it the most stable gDEBugger release.
|