| Home | ||
| Products | ||
| Download | ||
| Screen Shots | : | gDEBugger GL |
| Support | gDEBugger CL | |
| Free License | ||
| Customers | ||
| Company | ||
| Mailing List |
The gDEBugger main window contains toolbars and views. For a specific debugging or profiling task, you can customize the application to show only the necessary views and toolbars.

The Performance Graph view contains counters graphs of: gDEBugger, operating system, and vendor specific graphic boards (currently NVIDIA, ATI/AMD, S3 Graphics and 3DLabs). For example: CPU/GPU idle, graphic memory consumption, vertex and fragment processors utilizations, number of function calls per frame, frame per second, etc...

The Performance Dashboard view displays performance counters values as continuously changing vertical performance bars. These counters include: gDEBugger, operating system, and vendor specific graphic boards (currently NVIDIA, ATI/AMD, S3 Graphics and 3DLabs). For example: CPU/GPU idle, graphic memory consumption, vertex and fragment processors utilizations, number of function calls per frame, frame per second, etc...

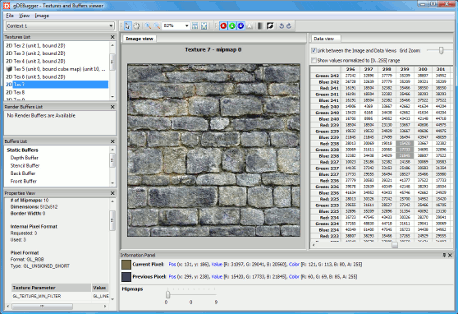
The Textures and Buffers viewer allows you to view all render contexts textures, static buffers and pbuffers (pixel buffers) objects.
Each object can be viewed both as an image in the image view and as a spreadsheet containing the object raw data in the data view. The object properties and parameters will appear in the properties view.
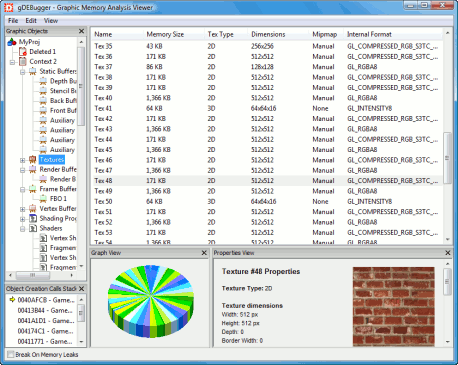
The Graphic Memory Analysis viewer displays information about graphic memory leaks and graphic memory allocated objects. With the Graphic Objects Application Tree view you can browse the allocated objects quickly by their render context and type. The objects' details can be viewed in the Graphic Object Details list as well as the Properties view.
Use the Object Creation Calls to see the scenario that led to each object's creation. Turning on the "Break on Memory Leaks" option will let you see which allocated objects are not cleared properly by your application.
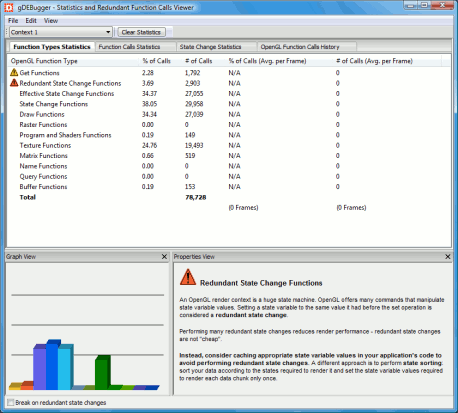
The Statistics and Redundant Function Calls viewer displays an in-depth statistical analysis of your application's OpenGL usage.
In the Function Types Statistics view, you can view a breakdown of your application's OpenGL usage to categories by functions' effects and actions.
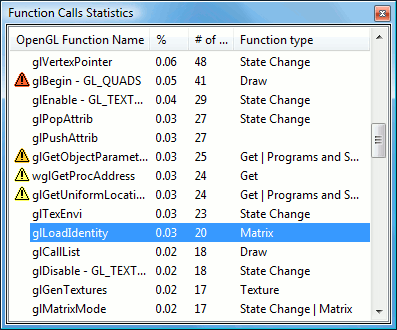
Looking at the Function Calls Statistics view, you will be presented with a breakdown of the OpenGL usage on an individual function basis, as well as warnings and recommendations about unrecommended function calls.
In the State Change Statistics view you can see the information collected by gDEBugger's Analyze Mode on the effectiveness of OpenGL state change functions.
This viewer also contains the OpenGL Function Calls History view, allowing you to view the actions surrounding each of the unneeded OpenGL function calls.
The OpenGL Function Calls Statistics view allows viewing the number of times each OpenGL function call was executed in the previously rendered frame and it's percentage from the total functions execution count. The list is updated each and every time the process is suspended. This invaluable insight information of your application helps you locate (and then remove) redundant OpenGL function calls, state changes, etc.
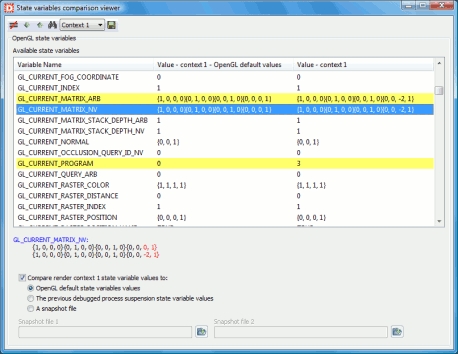
The State Variables Comparison viewer allows you to inspect the OpenGL state variables values. You can compare the selected context state variables values to the OpenGL default values, compare two state variables snapshot files, compare the selected context state variables values to a snapshot file or compare the selected context state variables values to the values recorded at the previous debugged process suspension.
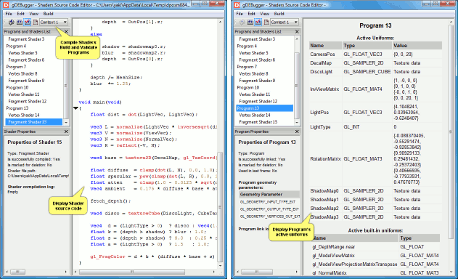
The Shaders Source Code editor displays a list of shading programs and shaders that exist in each render context, enabling you to edit shaders source code, recompile shaders, link and validate programs "on the fly". The editor views displays each shader's source code and parameters. Also displayed are program's attached shaders, active uniforms and parameters.
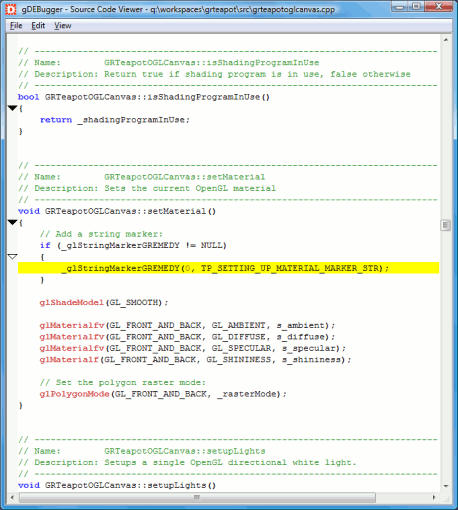
The Source Code Viewer displays a call stack frame function source code file. Open the Source Code Viewer by double clicking on a stack frame line in the Call Stack view. The line where a call to the next stack frame function appears is highlighted.
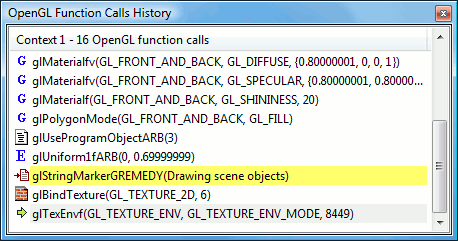
The OpenGL function calls history view displays a log of OpenGL, OpenGL extensions and WGL calls executed in each render context.
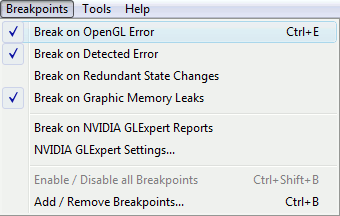
When this menu item is selected, gDEBugger will break whenever an OpenGL Error occurs in the debugged application.
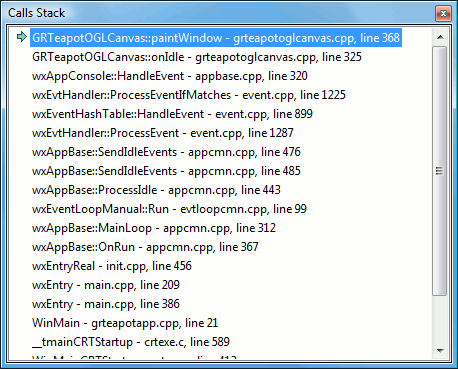
The Call Stack view displays the thread call stack that led to the function call suspending the debugged process run. Double clicking on a list line opens the Source Code Viewer, presenting the appropriate function call source code.
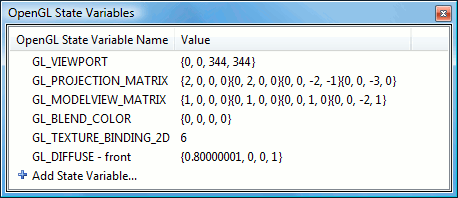
The OpenGL state variables view lets you watch OpenGL state variables values: current material, current projection matrix value, etc. Recently changed state variable values are highlighted in blue.
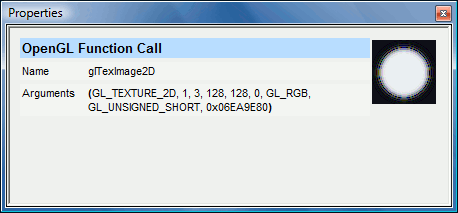
The properties view displays detailed information about items appearing in gDEBugger views. Example: Clicking on a logged OpenGL function call in the "OpenGL functions calls history" view will display the function name, its arguments and its associated texture image. Clicking on the texture image will open the Texture Viewer displaying the texture details.
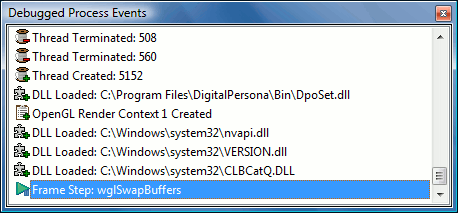
The process events view displays events that occur during the debugged process execution: Process Created, Process Run Started, DLL Loaded, DLL Unloaded, OpenGL Error, Second Chance Exception, Breakpoint Hit, Output Debug String, etc.
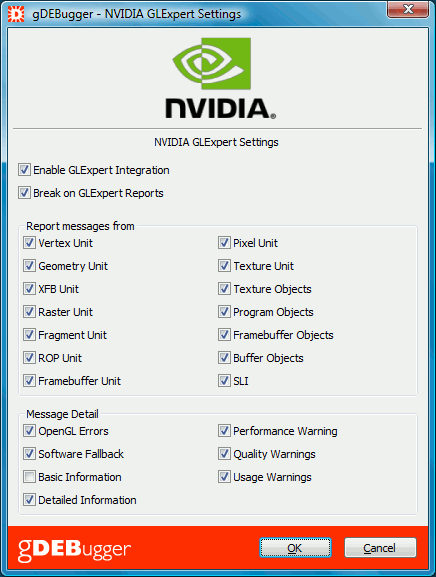
The NVIDIA GLExpert driver integration enables you to receive all GLExpert reports in gDEBugger. It also enables you to break the application run whenever a GLExpert report is triggered by the debugged application and receive the call stack and source code that caused the GLExpert report.
The GLExpert Settings dialog allows you configure all the NVIDIA GLExpert driver reports directly from gDEBugger.
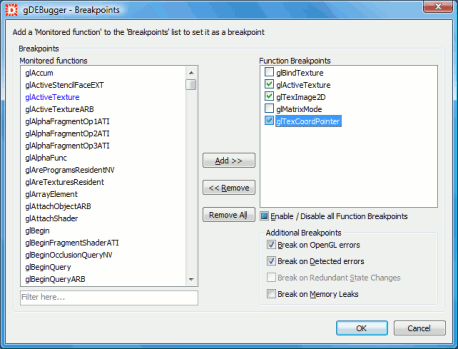
The breakpoint dialog lets you choose OpenGL function breakpoints. gDEBugger stops at these breakpoints before executing them, letting you observe the effect the breakpoint function has on application behavior.
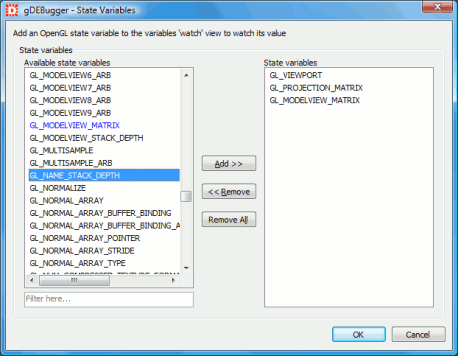
The State Variables dialog lets you choose OpenGL, WGL and OpenGL extension state variables. When the debugged process execution is suspended you will be able to see the selected state variables values in the State Variables view.
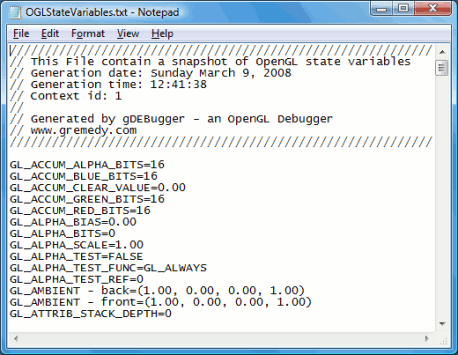
The "Save state variables" command lets you save a snapshot of the current OpenGL state machine into a text file. This text file contains the names and values of the supported OpenGL and extensions state variables.
A useful debug approach is to compare few OpenGL state machine snapshots and check for state variable values differences.
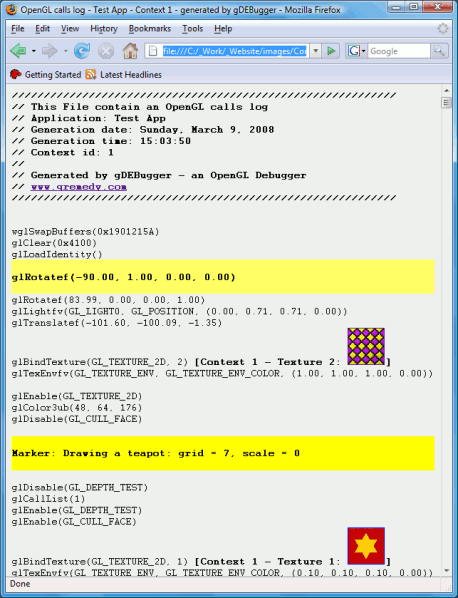
gDEBugger lets you record the OpenGL, WGL and extensions function calls history into a log file. The recording can be started, suspended and resumed at any time.
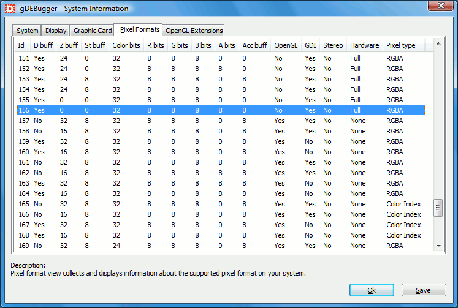
The system information dialog collects computer configuration data and OpenGL implementation details such as: operating system, memory, graphic card and driver details, monitor details, available pixel formats, available OpenGL extensions, etc.
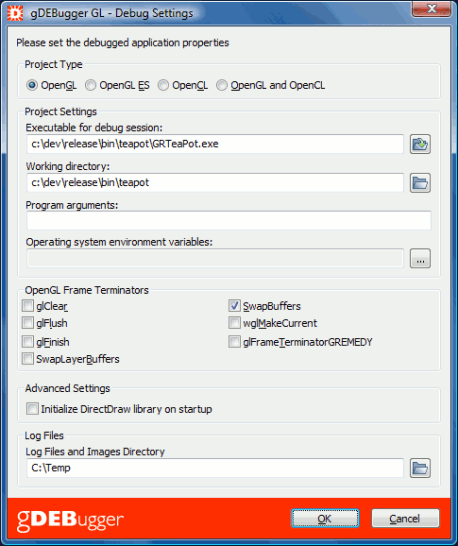
The debug settings dialog is where you define and setup the settings of the debugged application.
