
| Home | ||
| Products | ||
| Download | ||
| Screen Shots | : | gDEBugger GL |
| Support | gDEBugger CL | |
| Free License | ||
| Customers | ||
| Company | ||
| Mailing List |
The gDEBugger main window contains toolbars and views. For a specific debugging or profiling task, you can customize the application to show only the necessary views and toolbars.
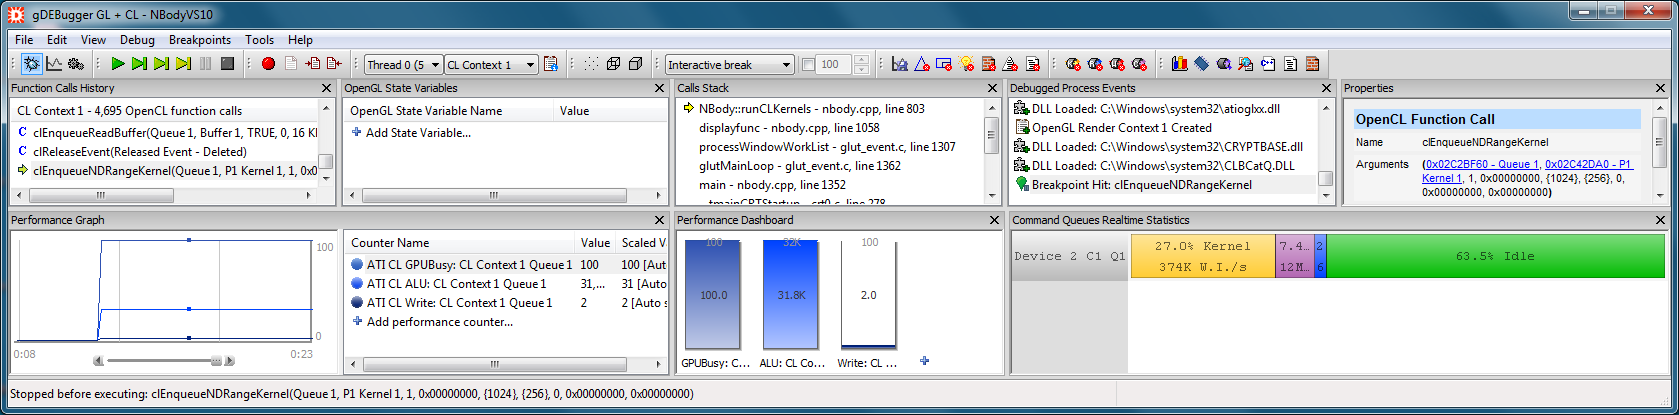
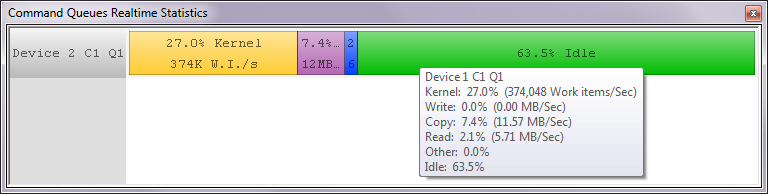
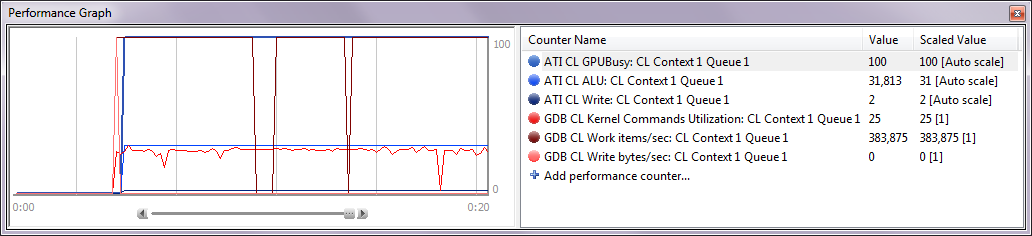
The Command Queues Real Time Statistics view displays, in real time, an overview of OpenCL command queues activities. The displayed information includes: Kernel, Read, Write and Copy Commands Utilization, Work Items processed/Sec, Read, Write and Copy MB/Sec.
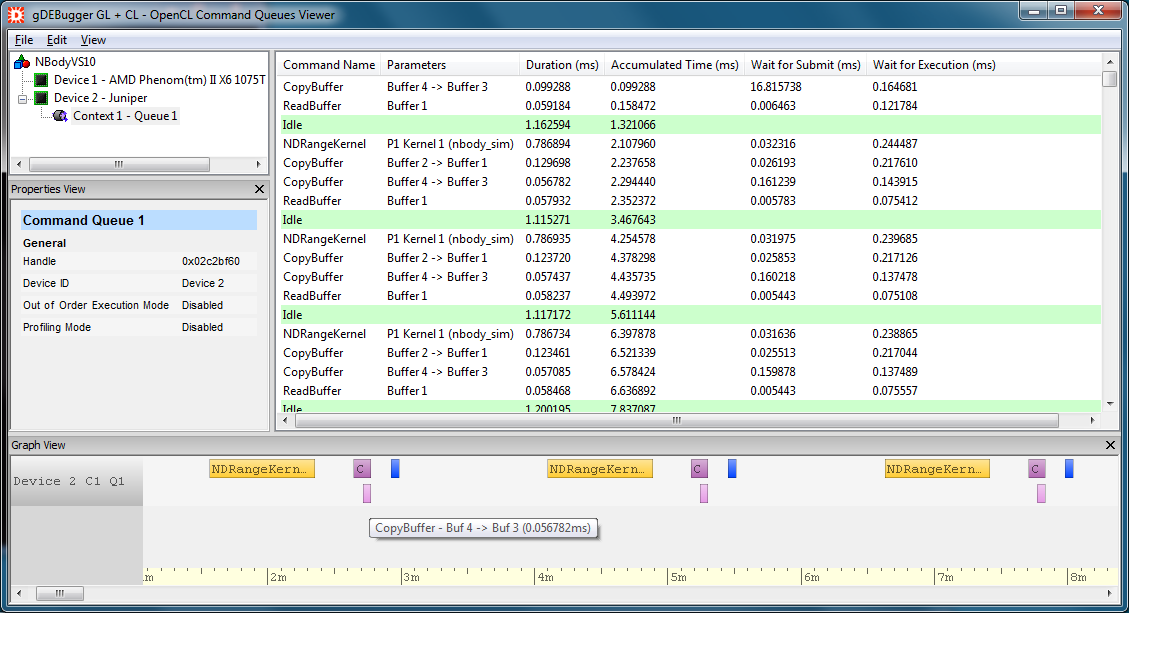
The Command Queues viewer displays a Ganntt chart of OpenCL queued commands timing. The displayed information includes the properties, duration, accumulated time, wait for submit and wait for execution times of each queued command.
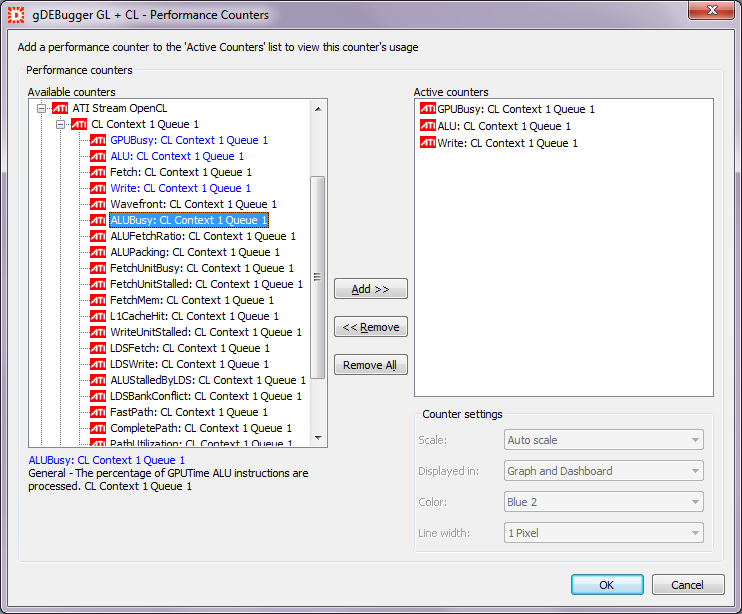
The Performance Graph view displays graphs of performance counters retrieved from various sources: gDEBugger's OpenCL server, operating system and OpenCL ICD vendors. For example: device busy, ALU Busy, average write instructions, L1 cache hit, Queue Idle, Work items/sec, Read bytes/sec, etc...
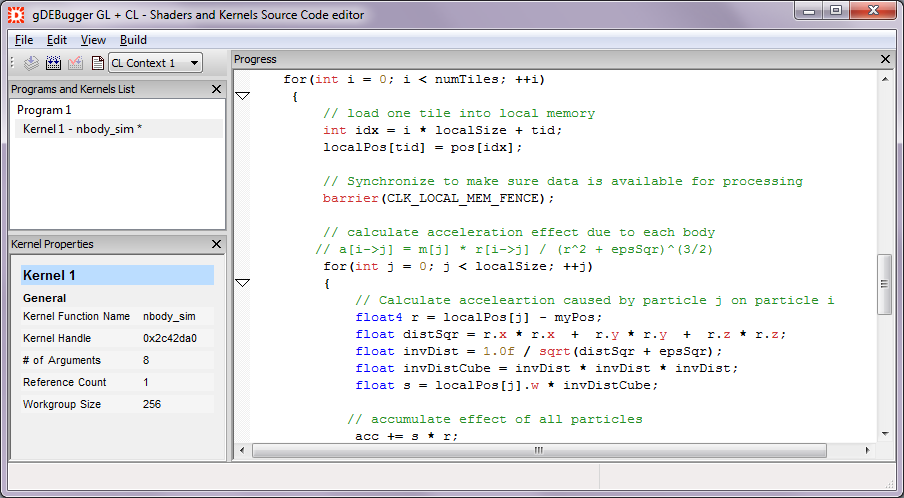
The Kernels Source Code editor displays a list of OpenCL programs and kernels that exist in each OpenCL context, enabling you to edit program's source code and recompile programs "on the fly". The editor views displays each program's and kernel's source code and parameters.
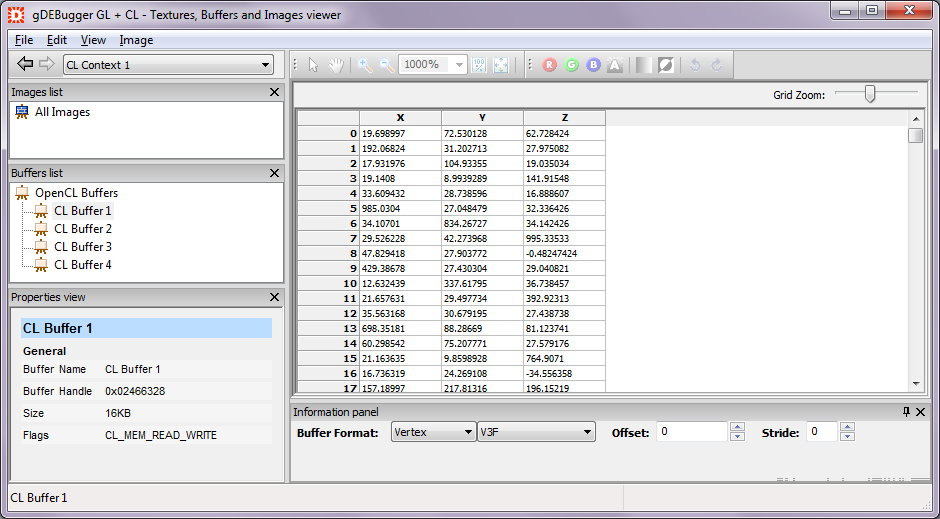
The Buffers and Images viewer allows you to view all buffer and image objects allocated using the OpenCL API. Each object can be viewed both as an image in the image view and as a spreadsheet containing the object raw data in the data view. The object properties and parameters will appear in the properties view.
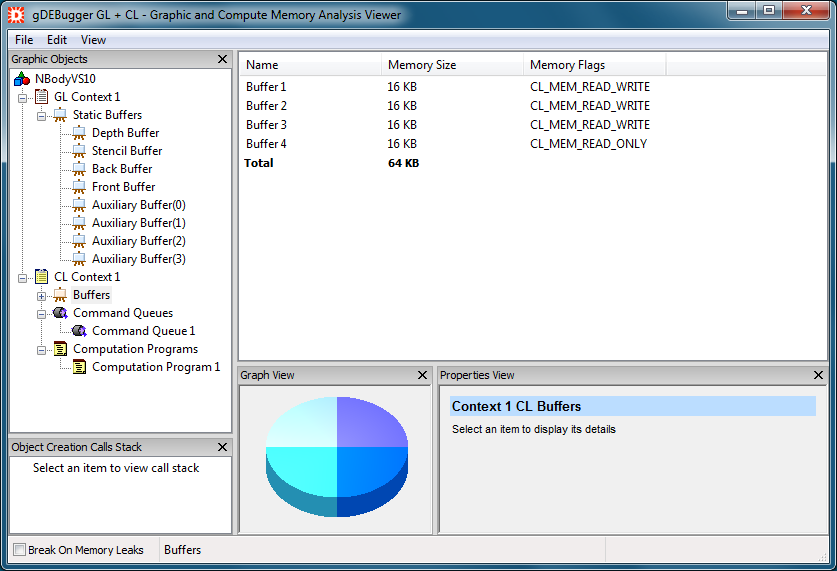
The Memory Analysis viewer displays information about OpenCL memory leaks and OpenCL allocated objects' memory. With the Objects Tree view you can browse the allocated objects quickly by their context and type. The objects' details can be viewed in the Object Details list as well as the Properties view.
Use the Object Creation Calls Stack to see the scenario that led to each object's creation. Turning on the "Break on Memory Leaks" option will let you see which allocated objects are not cleared properly by your application.
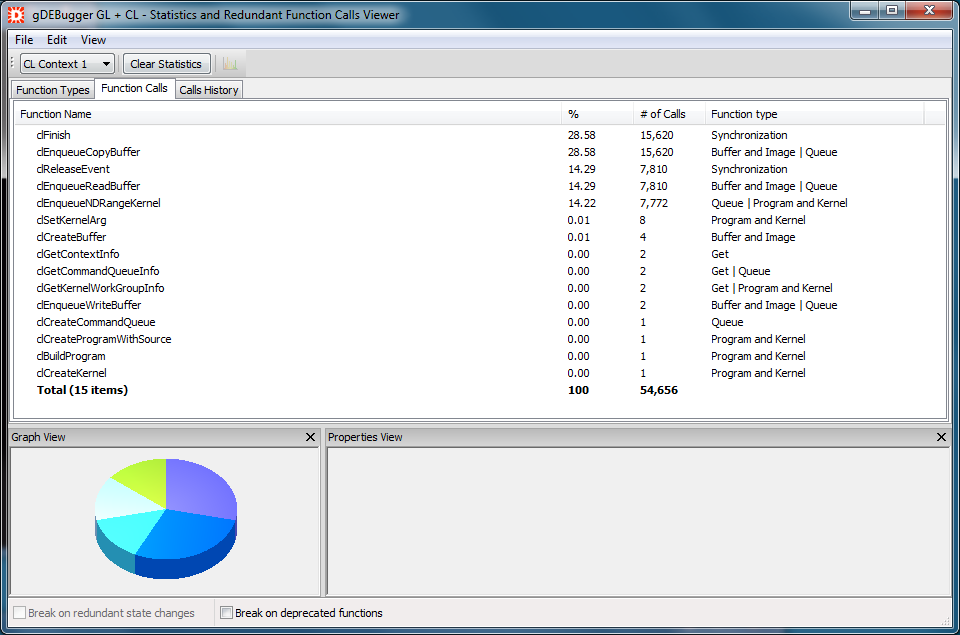
The OpenCL Statistics viewer displays an in-depth statistical analysis of your application's OpenCL usage.
In the Function Types Statistics view, you can view a breakdown of your application's OpenCL usage to categories by functions' effects and actions. Looking at the Function Calls Statistics view, you will be presented with a breakdown of the OpenCL usage on an individual function basis. This viewer also contains the OpenCL Function Calls History view, allowing you to view the actions surrounding each of the unneeded OpenCL function calls.
The Source Code Viewer displays a call stack frame function source code file. Open the Source Code Viewer by double clicking on a stack frame line in the Call Stack view. The line where a call to the next stack frame function appears is highlighted.
The Call Stack view displays the thread call stack that led to the function call suspending the debugged process run. Double clicking on a list line opens the Source Code Viewer, presenting the appropriate function call source code.
The process events view displays events that occur during the debugged process execution: Process Created, Process Run Started, DLL Loaded, DLL Unloaded, OpenCL Error, Second Chance Exception, Breakpoint Hit, Output Debug String, etc.
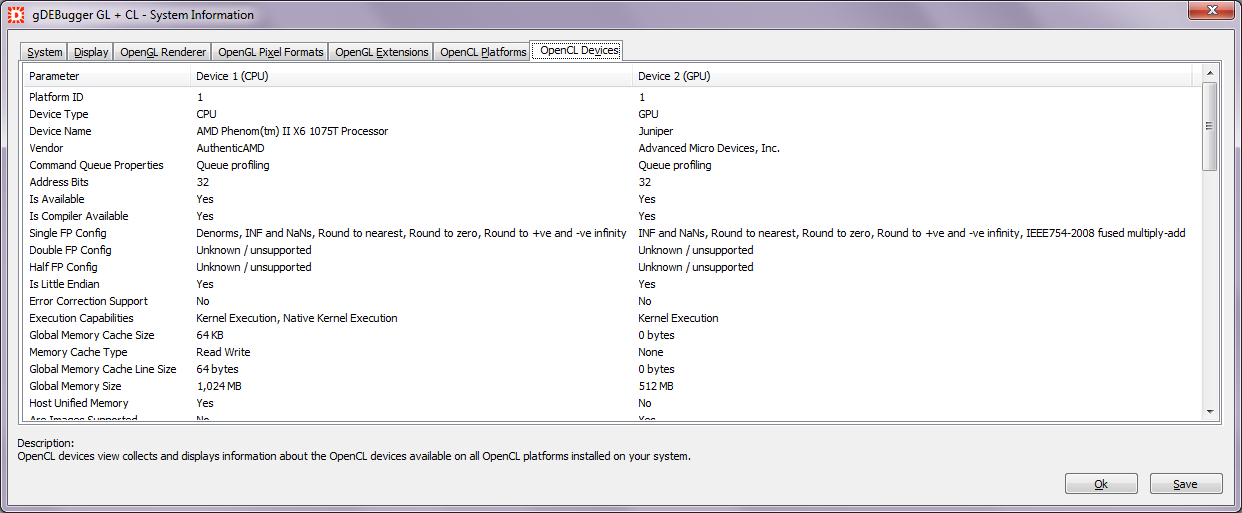
The system information dialog collects computer configuration data and OpenCL implementation details such as: OpenCL platforms, OpenCL devices, OpenCL extensions, etc.
|