
gDEBugger GL Features
Texture and Buffers Viewer
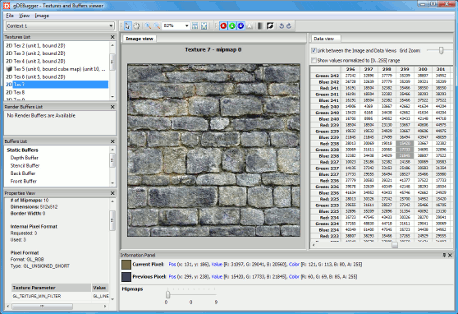
- View all created render contexts textures, static buffers, VBOs (vertex buffer objects), FBOs (frame buffer objects), render buffers and pbuffers (pixel buffers).
- Each object can be viewed both as an image in the Image view and as a spreadsheet containing the object raw data in the Data view.
- View object's properties and parameters in the properties view.
- Display the textures attached to each texture unit's 1D Texture, 1D Texture Array, 2D Texture, 2D Texture Array, 3D Texture, Cube Map Texture, Rectangle Texture and Texture Buffer bind targets.
- View, the currently highlighted pixel data and compare it to the selected pixel data.
- Scroll through the 2D images that make up the 3D image using the 3D Texture layer slider.
- Scroll through the textures that make up a textures array using the Texture array layer slider.
- Scroll through the different textures levels using the Mipmaps slider.
- Export texture or buffer image and raw data to disk.
- Zoom and pan toolbar allows you to zoom and scroll through the viewed image.
- Switch on or off a specific channel from the viewed image.
Statistics Viewer
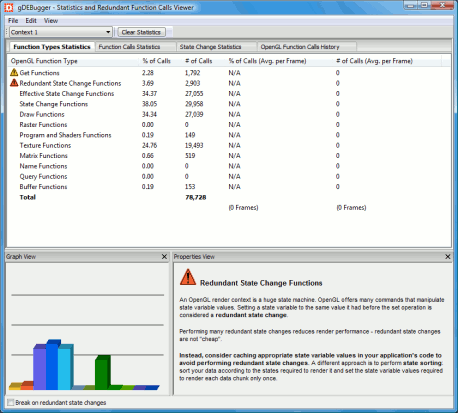
- Function Calls Statistics View displaying a breakdown of all the OpenGL functions used and useful tips and information about unrecommended OpenGL functions.
- State Change Statistics View displaying a statistics breakdown of the usage of state change functions - how many times was each function called, and how many of those times was the call effective.
- Deprecated Function Statistics View displaying a breakdown of the usage of functions deprecated by any OpenGL version. In Analyze Mode, this view also displays details about usage of deprecated features in partially deprecated functions.
- OpenGL Function Calls History View displaying the OpenGL and extensions calls history
- Vertex Batch Statistics View displaying a breakdown of vertex drawing OpenGL function calls (or vertex batches) by the number of vertices drawn in each.
- Break on Redundant State Changes checkbox, making the debugged application break whenever a redundant OpenGL state change is made.
Graphic Memory Analysis Viewer
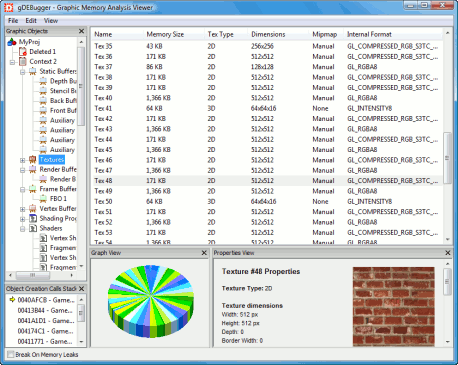
- Graphic Objects Application tree displays all the debugged application's allocated objects, by a hierarchy of Application --> Render Context --> (Object Type) --> (Specific Object).
- Graphic Object Details view lists all the graphic memory allocated objects of the selected type in the appropriate context.
- Automatically checks for graphic memory leaks.
- Break on Memory Leaks checkbox, making the debugged application break whenever a graphic memory leak is detected.
- Object Creation Calls Stack View displaying the creation call stack of each OpenGL object.
- A Graph View displaying a breakdown of the graphic memory consumed by the objects displayed in the Graphic Objects Details view.
- Properties View displaying the selected object properties.
Shaders Source Code Editor
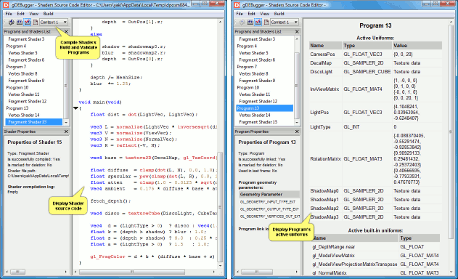
- View a list of shading programs and shaders that exist in each render context.
- Edit shaders source code, recompile shaders, link and validate programs "on the fly".
- View each shader's source code and parameters.
- View program's attached shaders, active uniforms and parameters.
State Variables Comparison Viewer
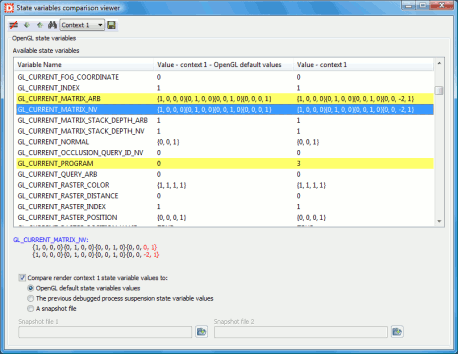
- Allows inspecting and comparing OpenGL state variables values
- Compare the selected context state variables to the context default state variables values.
- Compare the selected context state variables values to the values recorded at the previous debugged process suspension.
- Export the selected context values of all OpenGL state variables to a snapshot file
- Compare the selected context state variables values to a snapshot file.
- Compare two state variables snapshot files.
- Show all available state variables or just the variables that their values are not equal.
Source Code Viewer
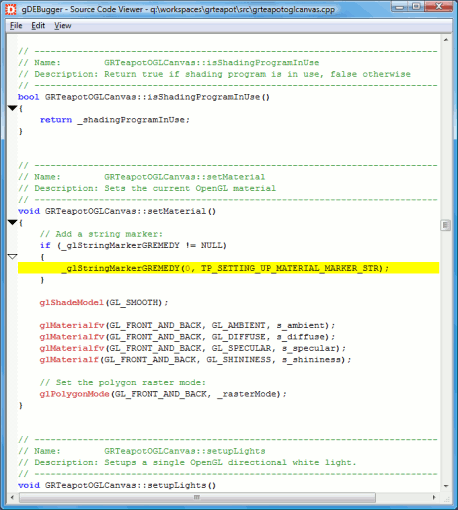
- View the source code associated with a call stack frame.
- Offers syntax highlighting for many programming languges.
- Highlights OpenGL functions and enumeration values
- Edit and save the loaded source code.
Call Stack View
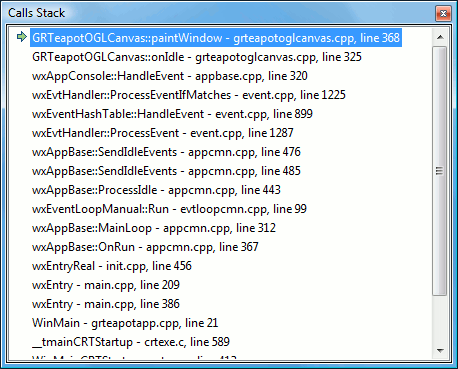
- View the thread call stack that led to the function call suspending the debugged process run.
- The thread call stack is displayed as a list. Each list item represents a stack frame.
- Each stack frame displays the associated function name, file path, line number, module name, instruction counter address and function address.
Calls History View
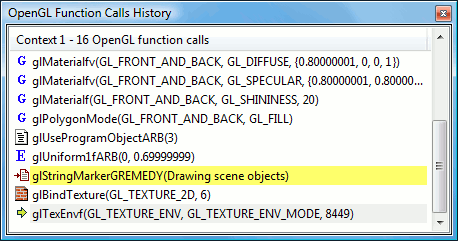
- Displays a log of OpenGL, OpenGL extensions, WGL, GLX, CGL, EAGL and EGL function calls executed in each render context.
- The function calls are displayed as a list, ordered by the time in which they were called.
- Each list line represents a single function call and contains: the called function name, its arguments values and the function type (as an icon).
- The function call that caused the debugged process suspension is marked using a yellow arrow.
- The function calls log can be saved to an HTML log file using a "Record" button.
Performance Dashboard View

- Displays performance counters values as continuously changing vertical performance bars.
- These counters include: gDEBugger, operating system and OpenGL driver, and vendor specific graphic boards (NVIDIA, ATI (AMD) and S3 Graphics). For example: CPU/GPU idle, graphic memory consumption, vertex and fragment processors utilizations, number of function calls per frame, frames per second, etc.
Performance Graph View

- Displays performance counters values as continuous line graphs.
- Select the color and line width for each line graph to distinguish it from the other graphs.
- When hovering over the graph with the mouse cursor, the List view displays the value at the point in time the cursor position represents.
- Save the collected performance data into a .csv file.
Process Events View
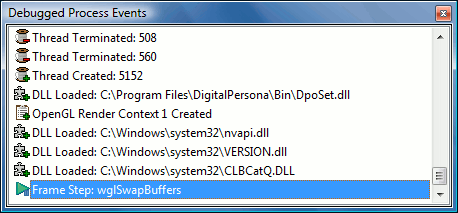
The Process Events View displays events that occur during the debugged process execution. Such events are:
- Process Created - The debugged process was created in the operating system.
- Process Run Started - The debugged process run was started.
- DLL Loaded - A dynamic linked library was loaded and mapped into the debugged process address space.
- DLL Unloaded - A dynamic linked library was unmapped from the debugged process address space.
- API Connection established - An API connection with one of the gDEBugger servers was established.
- API Connection ended - An API connection with one of the gDEBugger servers has ended.
- Context Created - An OpenGL render context was created.
- Context Deleted - An OpenGL render context was deleted.
- OpenGL Error - An OpenGL error occurred.
- Detected Error - A Detected error occurred.
- Second Chance Exception - A debugged process thread threw an exception. During the search for structured exception handlers, either no handler was found or the exception was continued. The process is about to exit
- Breakpoint Hit - A debugged process thread hit a breakpoint.
- Output Debug String - The debugged process sent a debug string to its debugger. This is usually done using the Win32 OutputDebugString function.
- Step / Draw Step / Frame Step - The debugged process was advanced to the next OpenGL function call using the appropriate Step button.
- Break - The debugged process execution was suspended using the Break button.
- Signal - The debugged process received a signal.
- Redundant State Change - A Redundant state change was was detected.
- Deprecated Function Call - A Fully deprecated function was called, or a partially deprecated function was called using a deprecated feature.
- Checking for Memory Leaks - gDEBugger checked for memory leaks at this point.
- Memory Leak - A graphic memory leak was detected.
- NVIDIA GLExpert Report (gDEBugger GL Windows only) - An NVIDIA GLExpert Driver report is reported.
Properties View
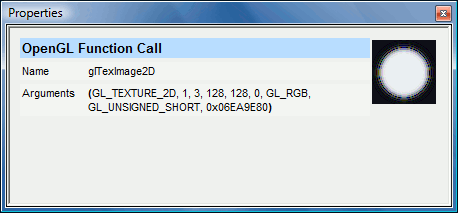
- Displays detailed information about items appearing in other gDEBugger views.
OpenGL State Variables View
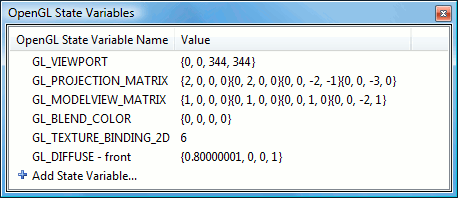
- The OpenGL State Variables view lets you watch OpenGL state variables values.
- The user can add or remove any supported OpenGL and extension state variable.
- The OpenGL state machine variables and values can be exported to a file.
Breakpoints Dialog
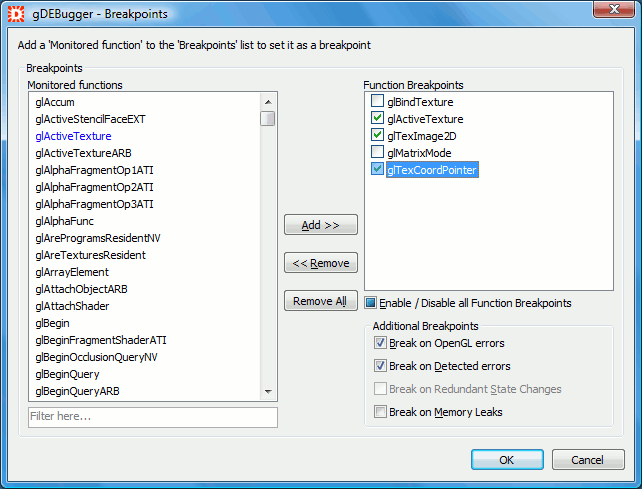
- Lets you choose OpenGL, WGL and OpenGL extension functions breakpoints.
- The debugged process execution is suspended when a debugged process thread calls a function marked as a breakpoint.
- Break on OpenGL Errors - When this check box is selected, gDEBugger will break whenever an OpenGL Error occurs in the debugged application..
- Break on Detected Errors - When this check box is selected, gDEBugger will break the application run when an error is detected by the gDEBugger OpenGL server.
- Break on Redundant State Changes - When this check box is selected, gDEBugger will break whenever a state change function is called, and has no effect (available only in Analyze Mode).
- Break on Deprecated Functions - When this check box is selected, gDEBugger will break whenever a function deprecated by any OpenGL version is called. If running in Analyze Mode, gDEBugger will also break whenever a deprecated feature is used (by a partially deprecated function).
- Break on Memory Leaks - When this check box is selected, gDEBugger will break whenever a graphic memory leak is detected.
Render Context Information Dialog
The Render Context Information Dialog displays render context and pixel format details such as:
- Render context status - Is the context active or deleted and whether it is sharing it resources with another context or using another context's resources..
- Render context information - General information about the context: activity status, OpenGL version, resource sharing details (click the context names to view their details), forward-compatibility, backward-compatibility, renderer details, etc.
- Pixel Format Information - Detailed information about the context's pixel format - Hardware acceleration, is the Context stereographic, is the context double-buffered and the number of bits in each channel (RGBA channels as well as Depth, Stencil and Accumulation buffers).
NVIDIA GLExpert Settings Dialog
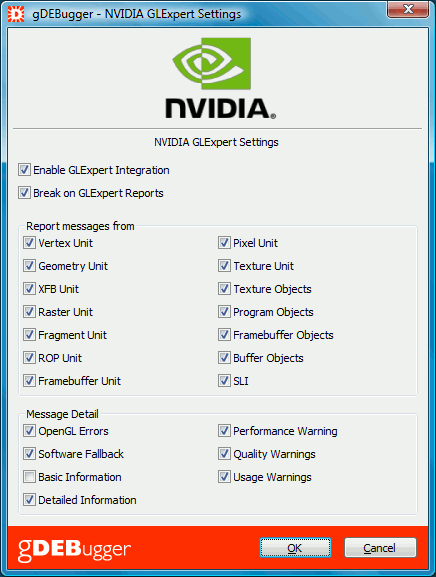
- Enables the NVIDIA GLExpert driver reports to appear in gDEBugger's Process Events View (gDEBugger GL Windows only).
- Break on GLExpert Reports - When this check box is selected, gDEBugger will break whenever an NVIDIA GLExpert report is reported in the debugged application.
- Report Messages From - Choose the pipeline stages and / or objects you wish to recieve GLExpert Reports from.
- Message Detail - Choose what kind of messages you wish to recieve. Note that all message detail options except "OpenGL Errors" and "Software Fallback" also require at least one of the "Report messages from" checkboxes to be chosen..
System Information Dialog
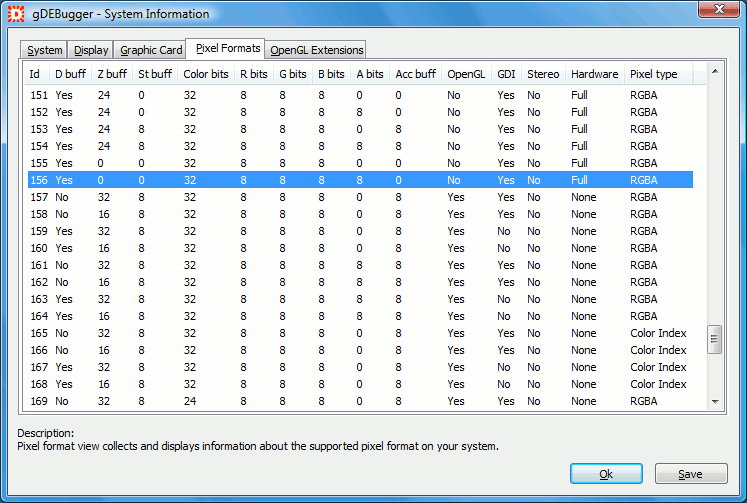
The System Information dialog collects computer configuration data and OpenGL implementation details such as:
- System View - Displays information about the configuration of your system
- Display View - Displays information about the configuration of your display system.
- Graphic Card View - Displays information about the configuration of your graphic accelerator system.
- Pixel Format View - Displays information about the supported pixel format on your system.
- OpenGL Extension View - Displays information about the supported OpenGL extensions on your system..
Debug Toolbar
The Debug Toolbar allows quick access to debug commands such as:
- Go - Start/resume debugging the debugged application with gDEBugger.
- Frame step - Advance the debugged application process to the next OpenGL frame terminator as chosen in the debug settings.
- Draw step - Advance the debugged application process to the next OpenGL "visible draw" function call.
- Step - Advance the debugged application process to the next OpenGL function call.
- Break - Suspend the debugged application process run at the next OpenGL function call.
- Stop debugging - Stop the debugged session.
Execution Mode Toolbar
The Execution Mode Toolbar allows the user to switch between gDEBugger's various execution modes. The available execution modes are:
- Debug Mode - Debug Mode enables most of gDEBugger's features. This mode is recommended for finding and solving OpenGL errors and for general debugging of OpenGL applications.
- Profile Mode - Profile Mode removes CPU intensive logging operations performed by the gDEBugger OpenGL implementation, such as Textures Data Logging and OpenGL Calls History Logging. While many of gDEBugger's features are disabled in this mode, it provides a performance experience as close to running the application outside gDEBugger as possible. This mode is recommended for performance analysis.
- Analyze Mode - Analyze Mode tracks detailed statistics about OpenGL usage, deprecated features and state changes. Using this mode dramatically reduces performance. This mode is recommended for finding redundant state changes, deprecated feature usage and for statistical analysis of OpenGL usage on a single-frame basis.
Interactive Mode Toolbar
- The Interactive Mode Toolbar lets you view your graphic scene as it is being rendered, in full speed or in slow motion mode.
- The Interactive Mode Combo Box lets you to choose from the following four options:
- Interactive Break - Force OpenGL SwapBuffers/glFlush when the debugged process is being suspended.
- Normal Mode - Disable the interactive mode option.
- Front Buffer - Force OpenGL to draw into the front color buffer.
- Front Interactive - Force OpenGL to draw into the front color buffer and execute glFlush after each executed OpenGL command.
- Slow Motion Mode Check Box - The Slow Motion Mode Check Box enables/disables the slow motion mode.
- Slow Motion Spin Control - In the Slow-Motion Spin Control, you choose the unit amount for the slow-motion delay time. The delay will be applied after every OpenGL function execution.
OpenGL Calls History Toolbar
The OpenGL Calls History Toolbar lets you access the Calls History Commands, such as:
- Start / stop recording the OpenGL calls log to a file.
- Display log file - Open the active context recorded HTML log file.
- Next / Previous Marker - Scroll the OpenGL Calls History view to the next / previous string marker function call.
Performance Analysis Toolbar
The Performance Analysis Toolbar offers tools that enable identifying application's graphic pipeline bottlenecks. Such commands are:
- Eliminate all Draw Commands - This command causes the gDEBugger OpenGL implementation to ignore all OpenGL function calls that push primitives or raster data into OpenGL (glVertexXX, glDrawElements, glDrawPixels, etc). When this command is on, the CPU execution and bus transactions are active. However, most GPU actions are inactive since they are activated per primitive/ raster data. This command helps identify CPU and bus transactions bottlenecks. If eliminating all draw commands does not improve significantly the application performance; then your application is CPU or bus transactions limited.
- Force Single Pixel View Port - This command forces the gDEBugger OpenGL implementation to use a 1X1 pixels view port instead of the application-defined view port. OpenGL raster operations are triggered per fragment / pixel. Forcing OpenGL to use a single pixel view port removes most the executions performed by raster operations. Consequently, using the "Force Single Pixel View Port" command enables the identification of raster operation related bottlenecks. If forcing a single pixel view port improves the application performance; then your application is raster operations limited.
- Render using no lights - This command forces the gDEBugger OpenGL implementation to render using no lights instead of the application-defined lights. This command enables the identification of lights related computations performance bottlenecks. If forcing the render using no lights improves the application performance; then your application is lights related computations limited.
- Force Stub Textures - This command forces the gDEBugger OpenGL implementation to use a 2X1 (1D), 2X2 (2D), 2X2X2 (3D) and 2X2 x 6 (cube map) textures instead of the application-defined textures. Forcing the use of such small textures guarantees that the textures data constantly remains in the textures memory cache. Texture cache fetch operations occur when the used textures data does not reside in the textures cache and, consequently, must be fetched into it. Using the "Force Stub Textures" command enables the identification of texture cache fetch performance bottlenecks. If forcing stub textures improves the application performance; then your application is texture data fetch limited.
- Force Stub Geometry Shader - This command forces the gDEBugger OpenGL implementation to detach all geometry shaders, and to use a very simple fragment shader instead of the application-defined fragment shader. This command enables the identification of geometry shader related performance bottlenecks. If forcing the use of a stub geometry shader improves the application performance; then your application is geometry shader or fragment shader limited. Use the "Force Stub Fragment Shader" command to identify whether your application is geometry or fragment shader limited. If your application does not use geometry shaders, this command functions the same as "Force Stub Fragment Shader".
- Force Stub Fragment Shader - This command forces the gDEBugger OpenGL implementation to use a very simple fragment shader instead of the application-defined fragment shader. This command enables the identification of fragment shader related performance bottlenecks. If forcing the use of a stub fragment shader improves the application performance; then your application is fragment shader limited.
Raster Mode Toolbar
The Raster Mode Toolbar enables you to force the OpenGL polygon raster mode.
- Points - Force points polygon raster mode (GL_POINT).
- Wireframe - Force wire polygon raster mode (GL_LINE).
- Fill - Force fill polygon raster mode (GL_FILL).
Threads and Contexts Toolbar
The Threads and Contexts Toolbar allows quick navigation between the contexts and threads, gDEBugger views will display the relevant thread/context information.
- Threads Combo Box - The Threads Combo Box allows you to choose the thread to be displayed. The related information will be shown in the gDEBugger views.
- Context Combo Box - The Context Combo Box allows you to choose the context to be displayed. Related information will be shown in the gDEBugger views. Deleted contexts will be displayed as "Deleted".
General

- Supports all OpenGL versions up to version 3.1 standard and additional OpenGL, WGL and GLX extensions.
- Supports Windows 7, Windows Vista, Windows XP and Linux i386 and x86_64 architectures.
- Enables debugging of 32-bit and 64-bit applications.
- Supports multi-context and multithreaded applications.
- Supports NVIDIA GPUs Performance Counters via NVPerfKit.
- Displays NVIDIA GLExpert driver errors and warnings.
- Supports ATI Hardware Performance Counters.
- Supports S3 Graphics Hardware Performance Counters.


 The Process Events View displays events that occur during the debugged process execution. Such events are:


 The System Information dialog collects computer configuration data and OpenGL implementation details such as:
